Pular para o conteúdo principal

Starting 2018 with a slower global growth?

It's been 6 months since I last wrote about global trade growth, so it's time to have a look again.
After a pretty good recovery since early 2016 and reaching 5% growth on year over year basis it seems now that it has lost some momentum, at least for a while. But what makes me more worried about next few months ahead is that most US and Germany economic surveys are at multi year highs. That should be a good news if it wasn't for he fact that historically those indexes hardly hold much longer at those levels. And when they turn they usually impact global trade, financial markets and stocks for a while.


Let's look first at some global trade indexes:

CPB Global trade volume looks to be loosing some steam...


RWI Index also has slowed.


Now some surveys in Germany and US:

Germany IFO and Europe Consumer Sentiment.


 US surveys also at multi year highs:


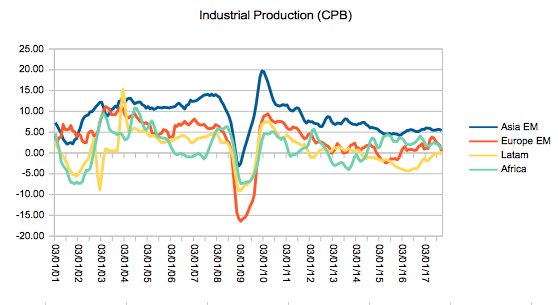
Now some industrial production indexes around the globe:


EM looks pretty flat and DM could turn for a while as talked above...


Except for latam all other regions are flat or losing some momentum...


 ...and Baltic Dry index...


Comentários

Postagens mais visitadas deste blog

It's no different this time...but the "timing"...

One of the biggest question (or the billion question) now is probably if the world and US is heading to a recession as the late cycle is not even a question any longer, as recent ECB and FED turn in monetary policy shows. After a few years of a synchronized global growth ( Link ) a very sharp deceleration in activity awoke markets and central banks late last years. To make things even scary in the market perspective the famous and widely watched 10 years minus 3 month US treasury curve went through the negative territory also (for the more optimists the 2Y x 10Y is still positive). If not big part of the problem trade wars certainly didn't help a late cycle economy but its hard to tell by how much. So this time is no different many would say. And they are right However (yes), the timing could be a bit different this time. First there are some signs of stabilization already on OECD composite leading indicators for Europe (who would guess that!!!) and china, with both impacting

What about the USD now?

Its no news that FX market is probably one the of the hardest to "predict". Maybe that's why I like it most, so I can be wrong very often and use this excuse..."its hard". Seriously, "predict" is not the perfect word to use for most of the financial assets because its a impossible task and carries a burden of a exact value, as many expect it to be. Instead, what is possible is to access all important variables and estimate the likely path, the odds,  levels and so on. Even so its nto easy, but we do it. We need to (at least to answer those friends and relatives that always ask "Should I buy USD now or later". I like to compare the FX market with weather forecast - now weather seems to be a more exact science!!!  We have longer term forecasts that has to do with cyclical factors like the 4 seasons. For the time horizon of weeks and months they measure pressure, currents, water temperature and many others to gauge what the weather will likely

BRL very expensive?

I read this news (link below) yesterday that indicates that BRL might be very expensive according to three models from Deutsche Bank. Though I don't have access to those models metrics, it got my attention because that information doesn't really fit very well with some simple models I run. I know there are lots of ways to model FX and as everyone might know its not a very easy market to figure out, specially for EM, where lots of feedback loops between country risk and FX rate happens and you can have long and short term models. Another point, specially for the PPP metric is the timeframe chosed. Anyway, just decided to post my findings here because they contrast with the DB picture. They might be right but here is my view: Business Insider (Australia) link for the news:  https://www.businessinsider.com.au/currency-valuations-september-deutsche-bank-2017-10 That's DB chart... My Behavioral model based on Commodities and CDS (YoY %) PPP metrics based on C